It’s hard to believe ten years have passed since LOSE YOUR BROKER NOT YOUR MONEY first hit the streets. The book, which began as a graduate school project in the early 1990’s, demonstrates the investment process using my stock selection method and patent-pending 15-51™ allocation system. My method follows basic logic and common sense, and when applied to achieve a specific purpose, produces extraordinary results on every level.
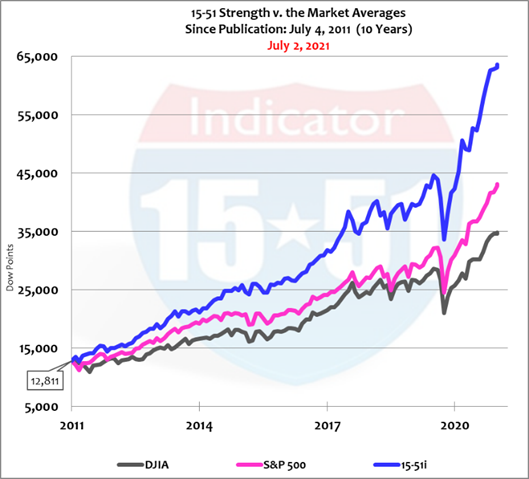
For instance, the objective of my 15-51i portfolio is to indicate stock market strength by consistently producing above-average stock market results, where the Dow Jones Industrial Average serves as the bellwether standard for “average.” And while the S&P 500 is not my direct target to outperform, 15-51 strength should routinely outperform both market averages.
Besides outperforming “the market” by return on investment (ROI), 15-51i strength must also move in a market-like way to achieve its objectives — thus proving market diversification, and thereby indicating “market strength.” It does so reliably (see chart below).
But the superiority of 15-51™ Strength goes far beyond that. In fact, my 15-51i portfolio produces less volatility and risk, greater strength and return – and because of it, produces far greater wealth more efficiently than any other market portfolio. See table comparing performance metrics below.
|
10- Year Report Card |
||||||||||
| Start | Current | Years | Avg. 10-Yr. Yield | |||||||
| 1-Jul-11 | 2-Jul-21 | 10.0 | 2.04% |
Avg. Volatility from Mean |
Systematic Market Risk | >1 Strong, <1 Weak, =1 Market Neutral | Excess Market Return | Return Per Unit of Risk | Risk Adjusted Return Per Unit of Risk |
Excess Return Per Unit of Risk |
| Index | Since | Total ROI | ROI/Year | Std Dev | Beta | Strength Factor | Alpha | Sharpe | Sortino | Treynor |
| DJIA | Publication | 172% | 17% | 4.3% | 0.79 | 0.92 | -1.9% | 3.55 | 5.57 | 19.2% |
| S&P 500 | Publication | 237% | 24% | 4.2% | 0.76 | 0.98 | 10.2% | 5.18 | 8.32 | 28.6% |
|
15-51i |
Publication | 396% | 40% | 4.0% | 0.53 | 1.17 | 26.0% | 9.36 | 16.64 |
70.4% |
Since the 15-51 Strength Indicator™ was first published back in 2011, the portfolio produced 194% more return than the Market Average with 5% less volatility, one-third less the level of systematic market risk; 15-51i was 23% stronger and produced between two and three times more return per unit of risk as the Market Average.
15-51™ methodology is an absolute game changer.
The 15-51i™ portfolio consistently outperforms the Market Averages because that’s what it was designed to do. It is a market diversified portfolio engineered with my sleek and powerful 15-51™ system, and is comprised of above-average stock components using my selection method.—That’s why it travels uphill at a faster pace during normal markets and rebounds quicker after corrections. The blend of superior design and construction is like adding a supercharged turbo package to a base model Audi. It’s a completely different world.
And just like high-performance vehicles designed and built better than the average, my 15-51i portfolio will continue to reliably outperform base model portfolios because it is regularly maintained to keep pace with the ever changing environment, and the wear and tear reality may cause.
Success is a continued pursuit, not a one-time act.
Stay tuned…
![]()