It’s been awhile since I’ve blogged but really nothing has changed. Persistent themes continue to play out.
The American economy – albeit the strongest in the world – continues to show signs of fracture. The most recent jobs report came in much weaker than expected and wage growth has consistently been described as “anemic” by all major accounts. National debt continues to balloon and the political landscape is in upheaval. And then, to top it all off, the initial estimate for first quarter market activity disappointed again, posting a paltry .5% gain. That rate was recently adjusted upward to .8% – still a poor number – which adds yet another notch to a long trend-line of weak and inconsistent growth.
At the same time foreign currencies have been gaining on the dollar. The Euro and Yen have shown particular strength, and the Wall Street Journal’s Dollar Index has lost 3% so far this year. This weak dollar dynamic arrives despite the expansion of easy money policies by these same foreign governments to combat weakening economic conditions there.
But gold is the real story. It’s up strongly in the year even after a recent decline. Its performance, along with yields, indicates weakness in the U.S. Year-to-date activity is shown below.
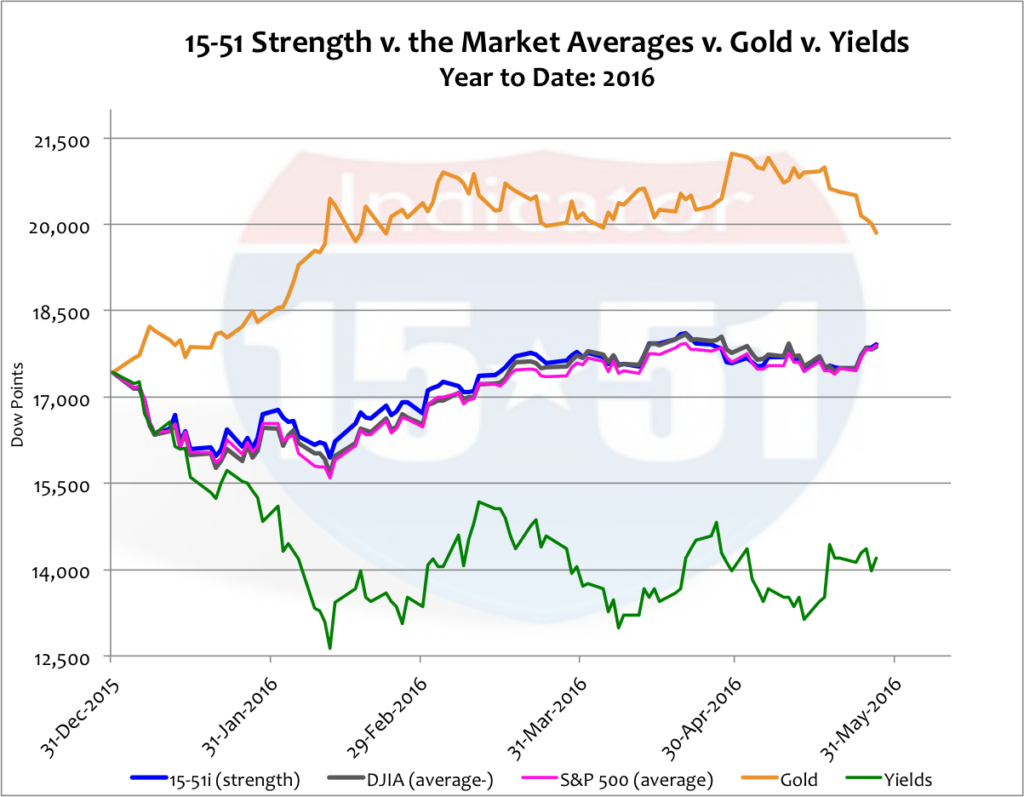
After falling sharply to begin the year stocks have seemed to regain footing. Following a strong performance last week (+2%), stocks are up 2.8% for the year. Gold is up big (14%) and yields are down significantly (18.5%). Together these metrics reflect the current Market condition – a weak dollar and a fragile economy.
Now, I have been blogging about the weak and uneven economy for a long time. But the stock market has completely disregarded that condition since it came onto the scene. See below.

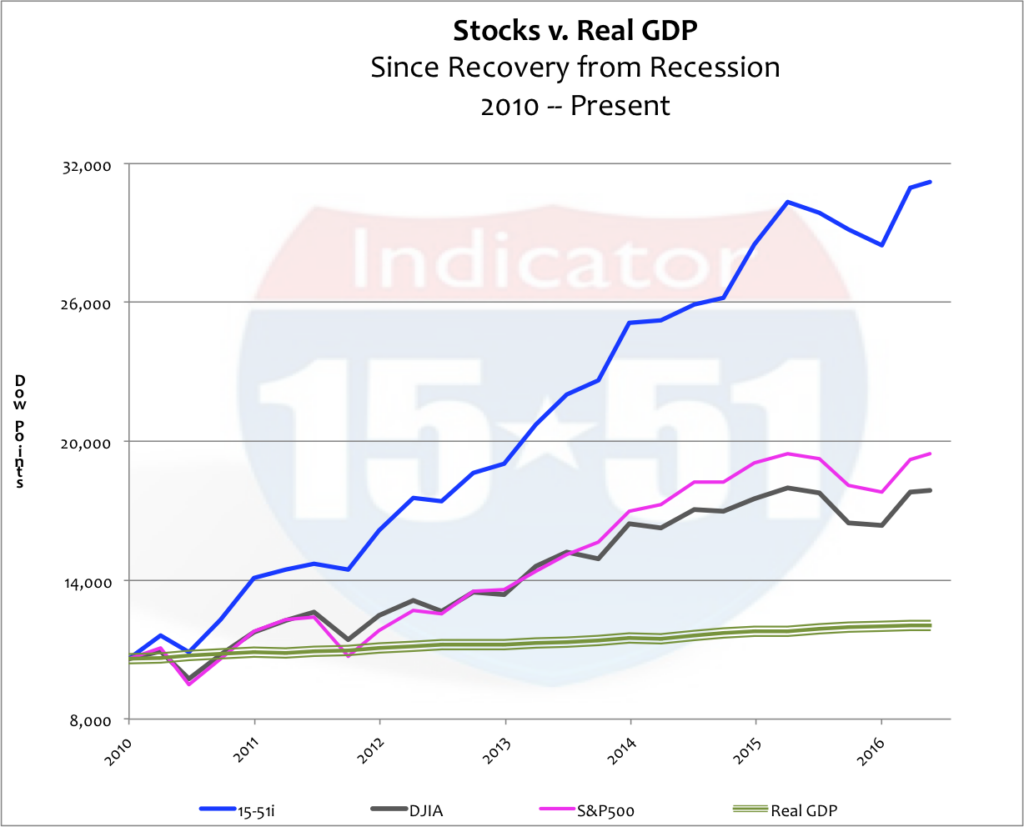
Stock market strength via the 15-51 Indicator has gained an amazing 194% since the economy emerged from recession; the S&P 500 has added 83%; and the economy grew just 13% in Real terms. That’s a huge anomaly!
Consider the following facts…
Since emerging from recession in 2010, U.S. central government spending remained at levels never seen before, averaging a $1 Trillion deficit per year. Allow me to repeat that absurdity: U.S. central government continued to add $1 Trillion in national debt per year, every year, since recovering from recession.
That’s way too much government spending during a recovery!
During that same time the national debt increased by $6 Trillion while the economy gained just $3 Trillion. In other words, every incremental dollar of long-term U.S. debt produced only fifty-cents of short-term economic benefit. This doesn’t even consider the $7 Trillion of new money printed by the Federal Reserve via quantitative easing (QE).
Only in government can that be considered good policy.
In 2010 the ratio of national debt to GDP was 90%. Today it is 107%.
When Bill Clinton left office in 2000 the government’s share of the economy was 17%. It reached 19% under Bush, and today Obama has pushed it to 22%.
In Real terms, the Clinton economy averaged 3.9% growth per year, Bush’s averaged 2.1%, and Obama’s has averaged 1.4%.
So there it is. The government is bigger, the free market is smaller – and growth is weaker.
That’s what domineering governments produce – just ask the Greeks.
So it is hard to argue the weakening position of the U.S. economy (more debt and less growth). But what about uneven?
Lets let the stock market illustrate that. But first, let’s define “the market” for some grounding.
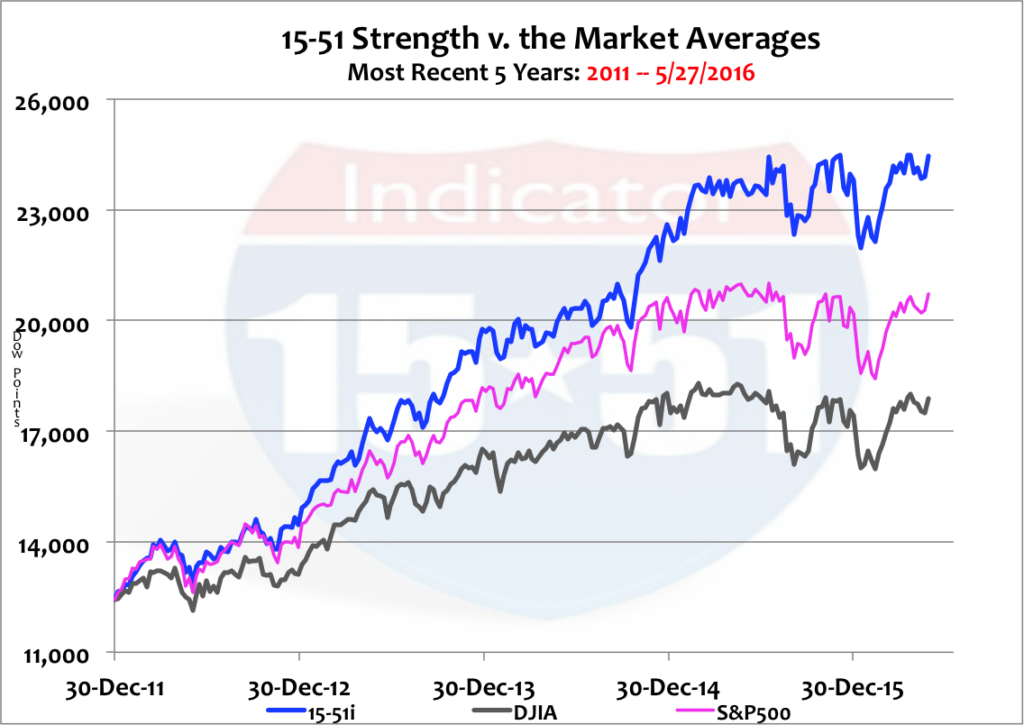
My 15-51 portfolio is a market portfolio, meaning it taps into all major industries and is allocated in a similar manner as broader market measures, like the Dow Jones Industrial Average and S&P 500. As a result it moves like those broader measures do. But because it is built with superior 15-51 construction it produces an above-average trend-line. This can be seen quite clearly in the chart below.

Okay, so my 15-51 portfolio moves in a market-like way because it is allocated similarly to “the market.” As a result, market allocations can be viewed through the lense of the 15-51 Indicator. Those allocations are shown below.

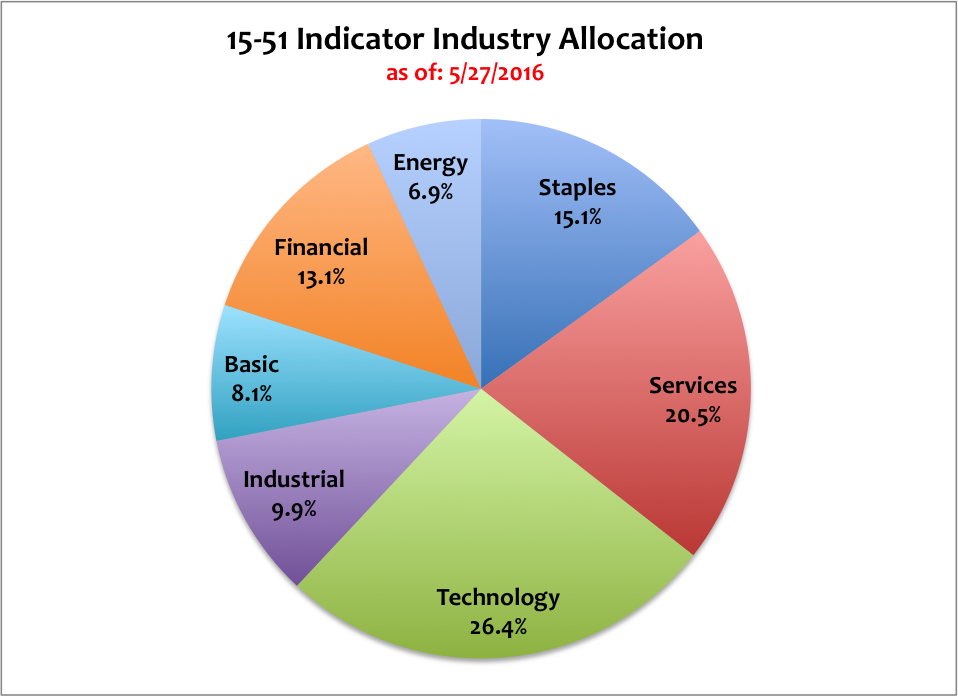
Solid economic expansions generally fire on all cylinders, meaning all industries contribute positively to growth. And technology usually leads the way, followed by the financiers of growth (financials) and the movers (energy) – all key ingredients to robust growth. Below is the current distribution of return on investment (ROI) by industry.

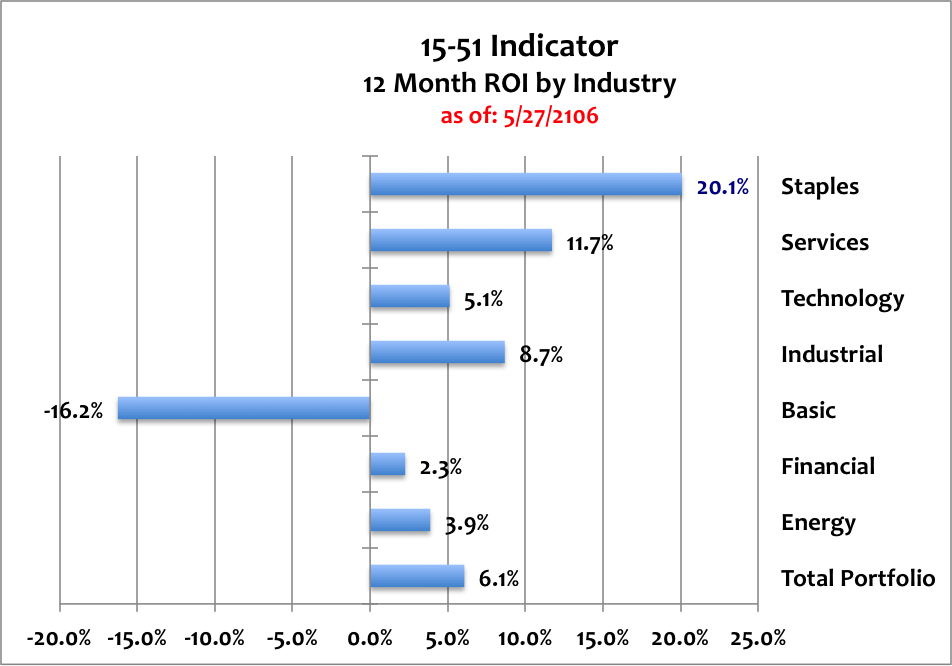
That’s the epitome of uneven — and the definition of ass-backwards.
Consumer Staples, the largest industry gainer, represents need based spending. Need sustains market mediocrity. Want propels it to prosperity.
Technology, financials, and energy are staples of want driven markets. They are above-average performers in strong economies, and are bottom-level performers in weak economies (like today’s).
The strength in consumer Services is driven by healthcare inflation – something ObamaCare has been unable to correct. And the weakness in Basic is spread across many sectors, including automobiles, farm equipment, small engines and engine components – again, a sign of economic weakness.
The highest gaining industry is up 20% and the worst performing industry is down 16%. And four of the seven industries, or 54% of “the market”, fail to beat the average. Uneven is the word.
The highest risk and growth industry is producing one-quarter of the growth that the most conservative industry is producing. That’s ass-backwards.
Stocks are reflecting a weak and uneven economy because stocks are strong in need-based sectors and weak in want-based sectors – yet overall valuations are higher now than they were at the pinnacles of the tech and housing booms. That makes for an unsustainable level of inflation.
And that’s the reason so many of us are expecting a severe stock market correction. Stocks simply don’t have the economic foundation to support current valuations.
It is important for this kind of dynamic to feed into an investor’s perspective when they establish or adjust their financial plans.
For instance, investors that have been using the 15-51 method for a long period of time have a completely different perspective than ones who have just started because they already have huge gains in the bank. As a result, it is easy for those investors to sit largely on the sidelines while they wait for the next major correction.
That’s not true for those just getting started. To those people I say this…
First, it is my firm belief that investors should never be all-in or all-out of the stock market. Second, investors should be appropriately allocated to the known conditions within the confines of their goals and risk tolerances.
As a gauge, for example, when it is apparent that stock values are high and the market is ripe for correction an investor’s stock allocation should represent an amount that they can withstand a 50% haircut for two to five years – because that can easily happen. The cash balance should be significant enough to at least double the stock market allocation at the buy point (low.) Triple is even better. This ensures a faster recovery.
Also, if a hedge allocation is employed, like gold, these values will rise when stocks are down. That may be a great opportunity to sell gold and reallocate some of those dollars to stocks. So it is possible then that an investor could add four or even five times the amount of their current stock allocation after correction.
The objective of stock market investing is to buy large quantities low and to sell them high in pieces along the path of recovery. And again, a comfortable cash allocation should always be present. There isn’t a need to go all-in with the superior ability of 15-51 construction.
My stock market posture is very conservative. Readers should know this when they consider my thoughts. I don’t mind missing the tops and bottoms, mostly because they are impossible to predict and it’s easy to get caught with your pants down if you try. But again, investors don’t need to have that psychic ability in order to earn robust investment returns.
To demonstrate these concepts in action, following is an investment simulation that begins at year-ended 2006, when the housing boom was in full gear. Valuations were high at that time – but remember the stock market didn’t reach its all-time high until October 2007. It crashed in the fall of 2008, but didn’t reach its bottom until March 2009. The economy emerged from recession in 2010, and stocks regained fair value in 2013.
In the following example (which can easily be applied to today and the near future), the portfolio was put on a conservative footing at the start of the period. At year-ended 2006 the allocations were as follows: Stocks 25%, Gold 25%, and Cash 50%.
My 15-51 Indicator will represent the stock portfolio; Gold is the GLD; and the cash balance is a non-income producing account, and cash is used only as a mechanism to make money – to buy low. Dividends have been omitted for the exercise, so the actual returns would have been larger than the results presented herein.
During the nine-year period from 2006 until present, there were three action points to reallocate and rebalance the portfolio, and they were triggered by market conditions and allocation anomalies.
After the conservative posture was established at year-ended 2006, the portfolio was reallocated for the first time in December 2008, when the Dow Jones Industrial Average bounced 1,000 points off its bottom – which wasn’t the true bottom (March 2009 was). The stock allocation was increased at that time, the gold allocation was maintained, and the cash balance was depleted to “buy low.”
The portfolio was adjusted again in February 2013 when stocks hit fair value. The stock allocation was also out of whack; it rose 10% above its target, a typical rebalancing trigger. To make the portfolio less aggressive, new target allocations were set lower for both stocks and gold. The cash allocation was increased.
The third and final adjustment came in November 2014 when stocks were considered “high” by any reasonable account – it wasn’t their highest point, however, that didn’t occur until the next year, in February 2015. A summary of how the allocations changed during these conditions is shown below.
| Start | Correction | Fair Value | High | |
| 29-Dec-06 | 5-Dec-08 | 15-Feb-13 | 14-Nov-14 | |
| 15-51i | 25% | 65% | 50% | 25% |
| Gold | 25% | 25% | 15% | 25% |
| Cash | 50% | 10% | 35% | 50% |
As you can see, the stock allocation started low and ended low (25% of the total portfolio) – as both times stocks were considered high — and never was the portfolio “fully invested.” And when stocks were considered low, the stock allocation rose to 65%. That’s the time to overweight in stocks.
But before I show you how the total portfolio performed, I want you to see how the stock trend looks with the buys and sells in it. See below.

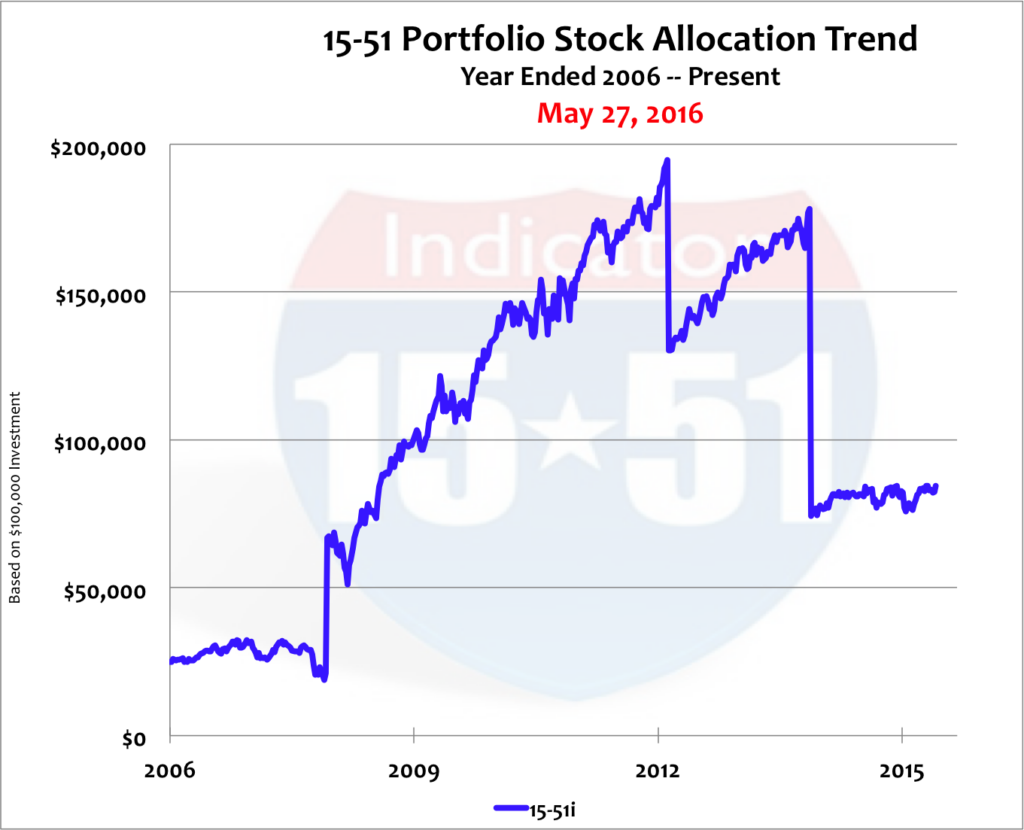
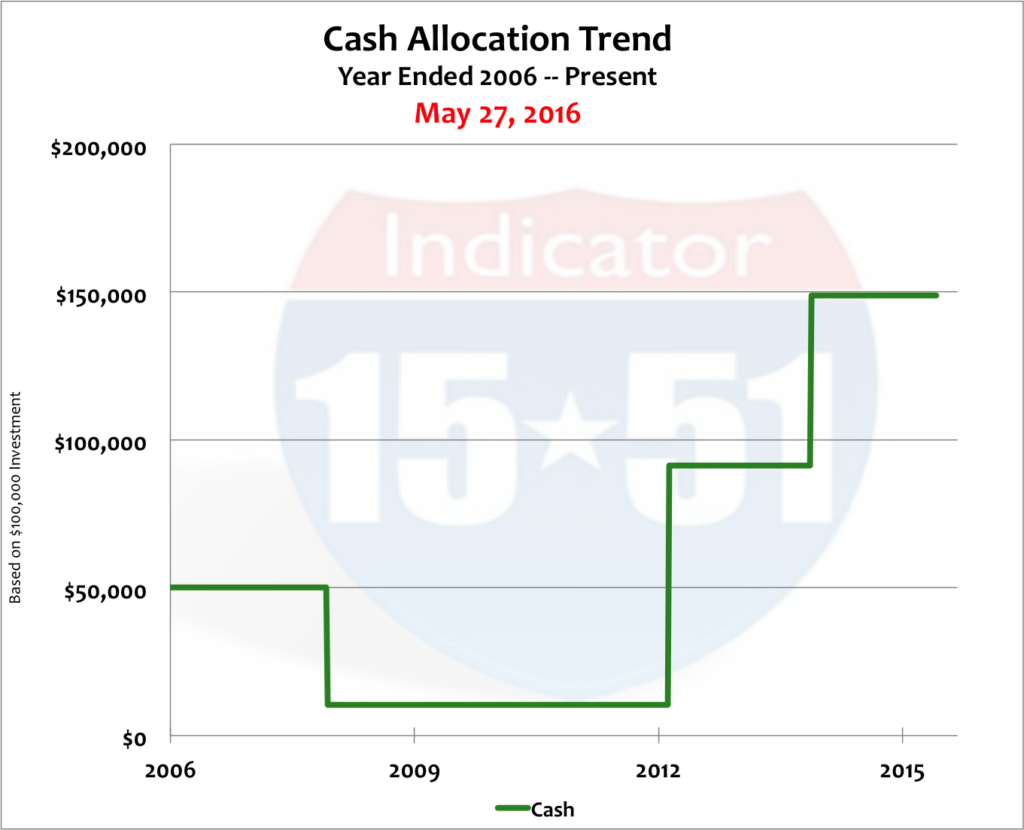
Those sharp vertical lines represent the buys and sells, the additions and depletions of capital. Below are the gold and cash trends. (Note: the gold allocation only changed twice.)

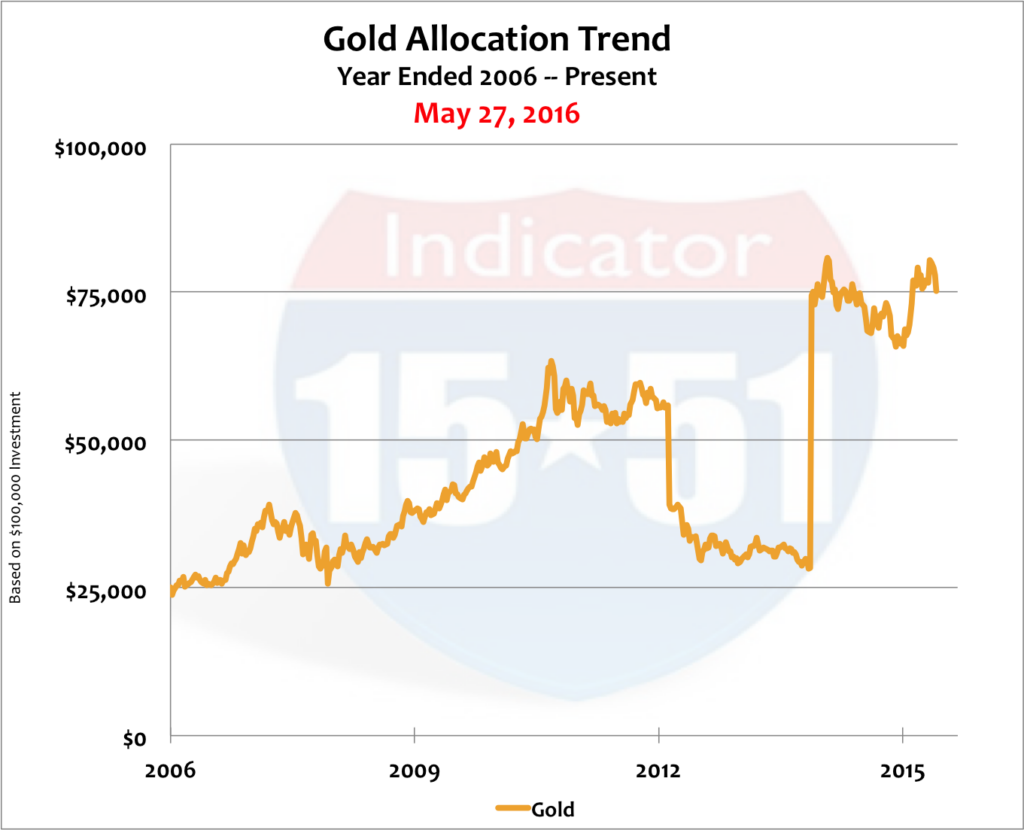
Those charts show how capital was reallocated during the three action points. Again, this is done to achieve objectives – to buy low and sell high, and to appropriately balances risk tolerance and return, according to my investment values. Below is how the total portfolio performed compared to broader market measures.

The three-asset class portfolio produced a stunning 208% return – more than 4 times “the market’s” output (48% for the S&P 500, and 43% for the Dow Average).
In addition the portfolio had less risk, less volatility, and less downside. But most importantly it preserved, protected, and accumulated wealth. The ending cash balance was 50% more than what the entire portfolio started with nine years earlier – and it still has $160,000 invested in today’s market. See the table of allocations below.
| 29-Dec-06 | 5-Dec-08 | 15-Feb-13 | 14-Nov-14 | 27-May-16 | |
| Total Portfolio | $100,000 | $102,972 | $260,646 | $297,618 | $308,342 |
| 15-51i | $25,000 | $66,932 | $130,323 | $74,405 | $84,381 |
| Gold | $25,000 | $25,743 | $39,097 | $74,405 | $75,152 |
| Cash | $50,000 | $10,297 | $91,226 | $148,809 | $148,809 |
That’s how to make money – and, more importantly, how to keep it.
All it takes is a plan, multiple asset classes, superior 15-51 construction, and action.
It’s never too late to change to a better course.
Stay tuned…
![]()