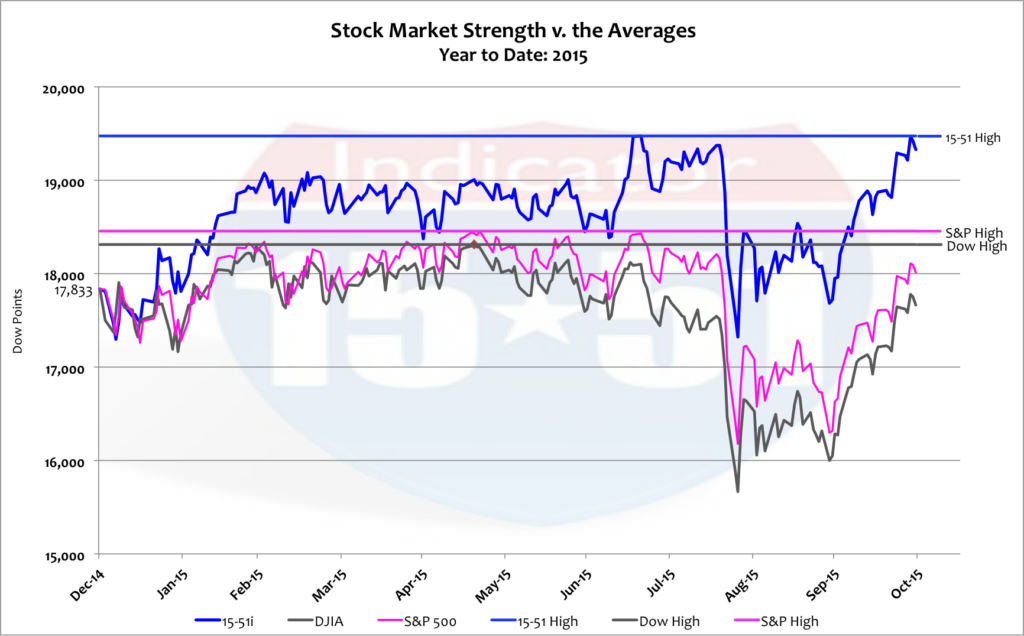
Stock market strength has fully recovered from the corrective shortfall it experienced in August. The S&P 500 is still off 446 points, or 2.5% from its previous high, while the Dow Jones Industrial Average (just an abysmal performing portfolio, see: WHAT’S WRONG WITH THE DOW — AND HOW TO FIX IT, for more info) remains 846 points off from its all-time high, or 3.7%. See below.

The benefits of 15-51 construction are abundant: it goes up faster and higher, corrects less, and recovers faster and higher than any other portfolio model. That makes it easier to make more money with less dollars at risk — and isn’t that the objective? But I digress…
As mentioned in previous blogs, START SPREADING THE NEWS and APPRECIATE THAT, the August correction was just the “first salvo in the next major corrective cycle.” I cautioned investors that “major market corrections like [the last one in 2008] take time to metastasize…” and reminded them that, “The first market rattle of the last major correction occurred in February of 2007 – eight months before the market topped, and eighteen months before the correction began its severe decline.”
I have pointed out many times how similar this stock market build-up is to the one that led to the ’08 crash. Another similarity can be seen again by how the stock market reacted after the first mini-correction of this cycle.
Take a look at the chart below; it shows how the Dow reacted after the first sign of trouble that hit the market in February 2007, when HSBC announced a surprise $4 billion charge related directly to subprime mortgage defaults.

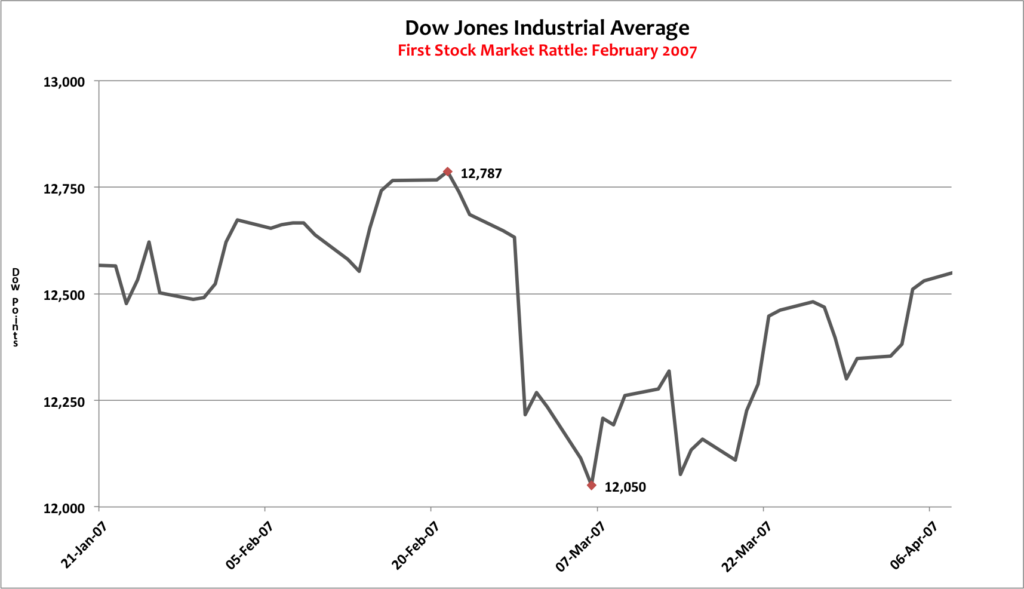
Just to remind you again, the Dow went on to hit its all-time high six months after this chart ends.–Not because the subprime mortgage dilemma went away but because media pundits and market “experts” rationalized that HSBC was just an “isolated situation” and that subprime defaults were not a systemic problem — even though bank after bank continued to fail.
That’s a very similar condition to today. The mini-correction that occurred in August 2015 was largely driven by the dramatic slowdown in economic output in China that seems to have gone away just two months later — at least where the stock market is concerned. Take a look at the chart below that shows how the Dow reacted after the mini-correction in August.

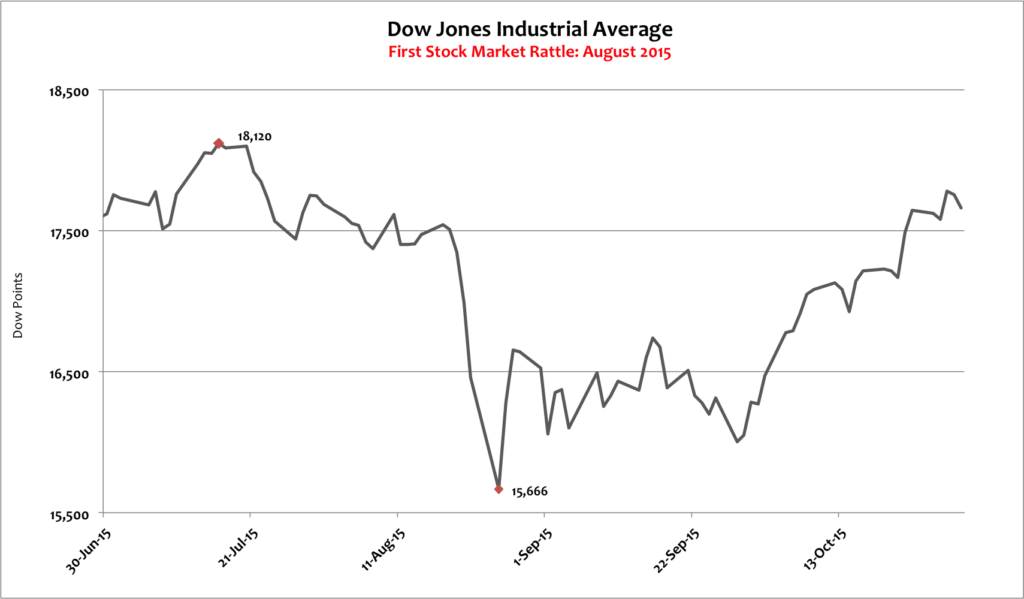
To draw a broad comparison to the two corrections, the Dow largely recovered to its previous high just two months after major negative news hit the market both times. Even though the 2015 mini-correction is choppier and more dramatic than the one in 2007, the timeframe and level of rebound are very similar.
And just like in ‘07, this stock market recovery hasn’t been driven by a turnaround in Market condition. This is corroborated by the Wall Street Journal which recently pointed out, “An indicator of Chinese factory activity showed an unexpected contraction in October, denting hopes that the world’s second-largest economy will post a fourth-quarter turnaround.”
It cannot be underestimated how important China was in the wake of the ’08 debacle. As central governments around the globe began spending ungodly amounts of money that they didn’t have, China was there to lend them a significant portion of that money. Today, China still has more than a trillion dollars of U.S. debt. Without Chinese demand for debt securities, it would have been much harder for world bankers to have kept interest rates low.
Explosive Chinese growth in the wake of the ’08 crash also helped a wide array of U.S. firms, from raw material suppliers, to consumer products companies, to professional service firms. Without Chinese demand lifting a substantial portion of the U.S. market, corporate profits, the job market, and the stock market, would have all taken much longer to recover.
Today that safety net is showing signs of wear, and can’t be counted on to bailout the world market the next time the mess hits the fan.
That’s a significant development.
And just like when the HSBC news hit the wire in February 2007, the Chinese problem of today isn’t an isolated situation and hasn’t gone away. Instead, the Chinese situation is emblematic of a weaker and more fragile global economy that is in dire need of freedom, leadership, and reform. Yet despite the absence of these enhancements, the stock market has swiftly recovered.
The lack of robust gain this year doesn’t mean that the stock market isn’t over-valued.
Consider that so far this year the Dow is down 1%, the S&P 500 is up 1%, and stock market strength via the 15-51 Indicator is up 8% — but all three stock market indicators remain near all-time highs. The pitiful Dow, for instance, is off just 3.5% since its May 19, 2015, high (18,312). It’s bottom this year is 2,000 points lower than where the Dow stands today (15,666). In other words, the stock market has largely regained the high valuation it lost when news of the economic slump in China hit the wire, making it seem like the Chinese news is isolated and no big deal.
Today’s stock market is a wolf in sheep’s clothing. Don’t be fooled by the costume!
Take a look at these recent Wall Street Journal headlines:
- U.S. Companies Warn of Slowing Economy
- Retail Figures Mostly Disappoint
- Consumers Spend Less Amid Soft Wage Gains
- U.S. Employment Costs Rise, Suggesting New Wage Pressure
- U.S. Consumer Spending Shows Caution
Add to this the recently released third quarter 2015 GDP metrics, where it was announced that 3rd quarter Real GDP growth came in at just 1.5% growth — that’s 62% less than the rate posted in Q2, and 65% less than the rate during the same period of last year.
Weak and uneven growth is a staple of the Obama economy. In fact, never before in history has the stock market been so consistently strong with such a weak and fragile underlying economy.
Think about it this way…in the seven years of the Obama administration the stock market is up on average 11% per year; while Real GDP has averaged just 1.8% growth per year. Compare that to the first seven years of the Bush administration, when growth in Real GDP averaged 2.4% per year and the stock market averaged just 3.9%.
The stock market is so much more over-valued now than it was seven years into the Bush years it isn’t even funny. That’s the reason the mini-correction in August was so much more severe than the one in February 2007. (FYI, the Feb. ’07 correction trimmed 6% off the Dow Jones Industrial Average from its previous high, and the Aug. ’15 correction shaved 14% from the Dow’s previous high value.)
The more over-valued a market is the more severely it corrects. That’s just the way it goes.
And that’s the dynamic you can expect during the next major correction — a sharper and more severe downward move followed by a slower and rockier road to recovery.
Stay tuned…
![]()